
The following are some common issues and questions that have arisen when building your textbook with Jekyll.
How can I update my book?
Sometimes Jupyter Book will get updates that you want to incorporate into a book you've already built. The easiest way to do this is to use the Command-Line Interface to upgrade your book.
To upgrade a pre-existing Jupyter Book, run the following command:
jupyter-book upgrade path/to/mybook
This will do the following:
- Generate a fresh Jupyter Book in
mybook_UPGRADEDusing the content files in your current book. - If this succeeds, copy over the contents of
mybook_UPGRADEDinto your current book folder. - If this succeeds, delete the
mybook_UPGRADEDfolder.
Note that only the content that you can manually specify via the jupyter-book create command
will be retained in your upgraded book. For a list of these options, see the help menu for this command:
jupyter-book create -h
You should check out the content in your upgraded book to make sure it looks correct, then commit the changes to your repository.
Does the book behave differently depending on the browser?
Maybe - Jupyter Book does use some features that might have different behaviors in some browsers. For example, Safari tends to treat downloadable objects differently for some reason.
The two browsers on which Jupyter Book should always behave as expected are Firefox and Chrome.
Why isn't my math showing up properly?
This book uses MathJax to render all math, with $ denoting inline math,
and $$ denoting multi-line math blocks. Make sure that all of your math
is wrapped in these characters.
Another tip is to remember to use escape characters when you don't want
math to be rendered and instead want an actual dollar sign to show up.
To do so, simply add a \ in front of the dollar sign. For example, I
can write \$35 by writing it like `\\$35` in the markdown.
How can I include interactive Plotly figures?
To display interactive Plotly figures, they must
first be generated in a Jupyter notebook using the offline mode.
You must then plot the figure with plotly.offline.plot(), which generates an HTML file (plotly.offline.iplot() does not),
and then load the HTML into the notebook with display(HTML('file.html')) prior to saving your *.ipynb file.
e.g.
from IPython.core.display import display, HTML
from plotly.offline import init_notebook_mode, plot
init_notebook_mode(connected=True)
.
.
.
plot(fig, filename = 'figure.html')
display(HTML('figure.html')
Note that, if viewing the file on a Jupyter Notebook session, the figure will not be displayed there (iplot is needed for this). However, if working on a JupyterLab session, the figure can be displayed there using the plot code above by having the JupyterLab plotly extension installed.
What if I have an issue or question?
If you've got questions, concerns, or suggestions, please open an issue at at the jupyter book issues page
How should I add cell tags to my notebooks?
You can control the behavior of Jupyter Book by putting custom tags in the metadata of your cells. This allows you to do things like automatically hide code cells as well as adding interactive widgets to cells.
There are two straightforward ways to add metadata to cells:
Use the Jupyter Notebook cell tag editor. The Jupyter Notebook ships with a cell tag editor by default. This lets you add cell tags to each cell quickly.
To enable the cell tag editor, go click
View -> Cell Toolbar -> Tags. This will enable the tags UI. Here's what the menu looks like.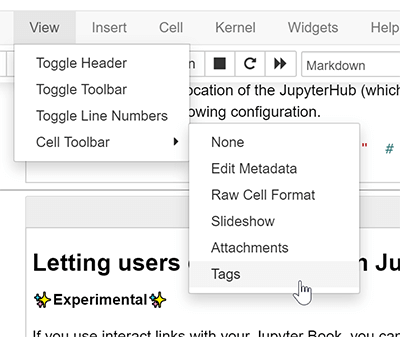
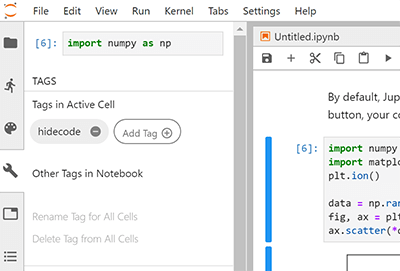
Use the JupyterLab Cell Tags plugin. JupyterLab is an IDE-like Jupyter environment that runs in your browser. It has a rich extension ecosystem. A particularly useful extension is the "cell tags" plugin, which exposes a user interface that lets you quickly insert cell tags.
You can install the cell tags plugin with the following command (after installing JupyterLab).
jupyter labextension install @jupyterlab/celltagsThen, you'll find tags under the "wrench" menu section. Here's what the tags UI in JupyterLab looks like.
Why doesn't math show properly when printing?
Currently, we use a library called PrintJS to handle printing of just the notebook content (when you click the "print -> PDF" buttons).
However, a drawback of this approach is that MathJax mathematics cannot access the same fonts available when you're viewing a page live. This means that mathematics often look simplified and incorrectly-formatted.
If you have an idea for how to improve this, please open an issue!
What is this Gemfile.lock file or why am I getting Jekyll dependency warnings?
The way that you define dependencies in the Ruby language is with a Gemfile. This is
like a requirements.txt file in Python - it defines the packages needed to deploy
a web application (in this case, our Jupyter Book). When you build the book, a new
file will be created called Gemfile.lock. This freezes the dependency versions that
are specified in your Gemfile, which is useful for things like cacheing your builds
to make them faster.
However, sometimes you want to un-freeze your dependency versions, often because you either wish to use new functionality in a package, or because you're getting a warning that there is a vulnerability in an old version of a package.
To update your Gemfile packages, simply delete Gemfile.lock and re-run make install.
This will generate a new Gemfile.lock with the latest versions of each package
specified in your Gemfile (unless you have explicitly provided a version number there).