Version 2.0.0b1.post7580.dev0+ge487118
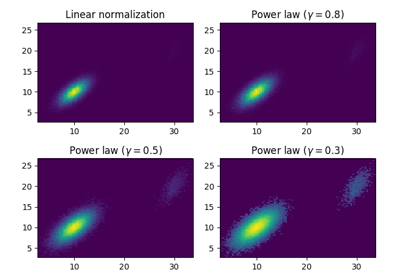
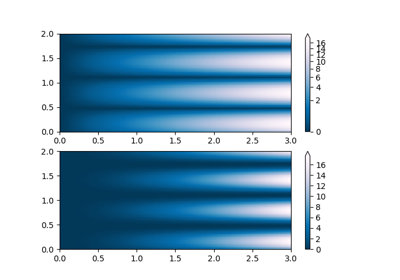
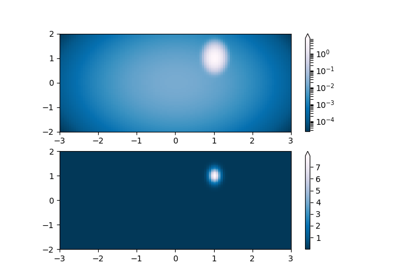
matplotlib.colors.PowerNorm(gamma, vmin=None, vmax=None, clip=False)¶Normalize a given value to the [0, 1] interval with a power-law
scaling. This will clip any negative data points to 0.
autoscale(A)¶Set vmin, vmax to min, max of A.
autoscale_None(A)¶autoscale only None-valued vmin or vmax.
inverse(value)¶matplotlib.colors.PowerNorm