Version 2.0.0b1.post7580.dev0+ge487118
Showing a cursor on multiple plots simultaneously.
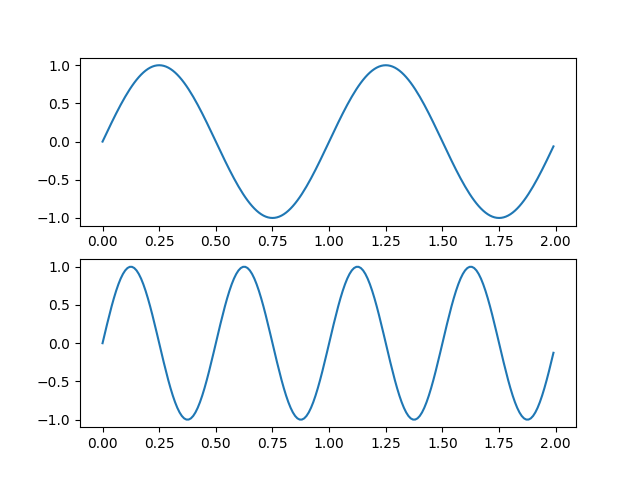
This example generates two subplots and on hovering the cursor over data in one subplot, the values of that datapoint are shown in both respectively.
import numpy as np
import matplotlib.pyplot as plt
from matplotlib.widgets import MultiCursor

t = np.arange(0.0, 2.0, 0.01)
s1 = np.sin(2*np.pi*t)
s2 = np.sin(4*np.pi*t)
fig = plt.figure()
ax1 = fig.add_subplot(211)
ax1.plot(t, s1)


ax2 = fig.add_subplot(212, sharex=ax1)
ax2.plot(t, s2)

multi = MultiCursor(fig.canvas, (ax1, ax2), color='r', lw=1)
plt.show()