Version 2.0.0b1.post7580.dev0+ge487118
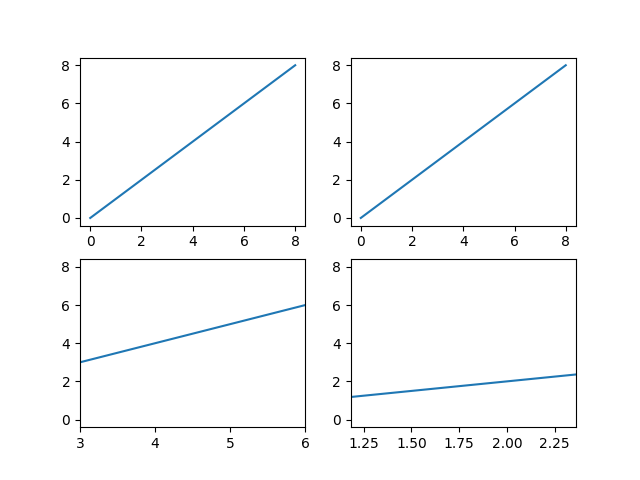
The example illustrates the ability to override default x and y units (ax1) to
inches and centimeters using the xunits and yunits parameters for the
plot function. Note that conversions are applied to get numbers to correct
units.
This example requires basic_units.py
from basic_units import cm, inch
import matplotlib.pyplot as plt
import numpy as np

cms = cm * np.arange(0, 10, 2)

fig = plt.figure()

ax1 = fig.add_subplot(2, 2, 1)
ax1.plot(cms, cms)

ax2 = fig.add_subplot(2, 2, 2)
ax2.plot(cms, cms, xunits=cm, yunits=inch)

ax3 = fig.add_subplot(2, 2, 3)
ax3.plot(cms, cms, xunits=inch, yunits=cm)
ax3.set_xlim(3, 6)  # scalars are interpreted in current units

ax4 = fig.add_subplot(2, 2, 4)
ax4.plot(cms, cms, xunits=inch, yunits=inch)
ax4.set_xlim(3*cm, 6*cm)  # cm are converted to inches

plt.show()