Version 2.0.0b1.post7580.dev0+ge487118

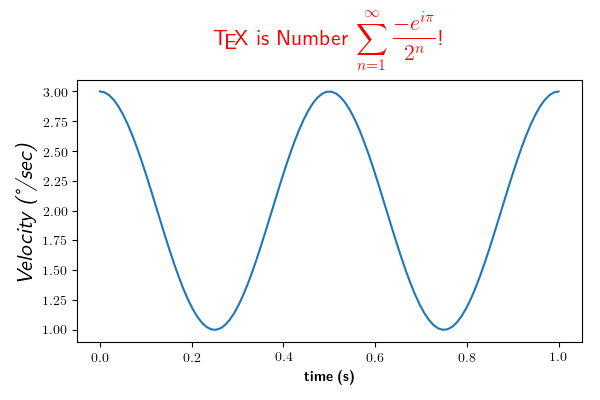
You can use TeX to render all of your matplotlib text if the rc parameter text.usetex is set. This works currently on the agg and ps backends, and requires that you have tex and the other dependencies described at http://matplotlib.org/users/usetex.html properly installed on your system. The first time you run a script you will see a lot of output from tex and associated tools. The next time, the run may be silent, as a lot of the information is cached.
Notice how the label for the y axis is provided using unicode!

from __future__ import unicode_literals
import numpy as np
import matplotlib
matplotlib.rcParams['text.usetex'] = True
matplotlib.rcParams['text.latex.unicode'] = True
import matplotlib.pyplot as plt


t = np.linspace(0.0, 1.0, 100)
s = np.cos(4 * np.pi * t) + 2

fig, ax = plt.subplots(figsize=(6, 4), tight_layout=True)
ax.plot(t, s)

ax.set_xlabel(r'\textbf{time (s)}')
ax.set_ylabel('\\textit{Velocity (\N{DEGREE SIGN}/sec)}', fontsize=16)
ax.set_title(r'\TeX\ is Number $\displaystyle\sum_{n=1}^\infty'
             r'\frac{-e^{i\pi}}{2^n}$!', fontsize=16, color='r')
plt.show()