Version 2.0.0b1.post7580.dev0+ge487118

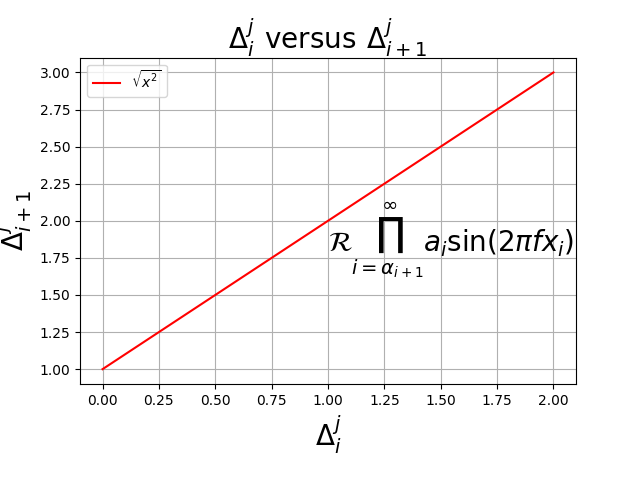
Use matplotlib’s internal LaTeX parser and layout engine. For true latex rendering, see the text.usetex option

import numpy as np
from matplotlib.pyplot import figure, show

fig = figure()
fig.subplots_adjust(bottom=0.2)

ax = fig.add_subplot(111)
ax.plot([1, 2, 3], 'r')
x = np.arange(0.0, 3.0, 0.1)

ax.grid(True)
ax.set_xlabel(r'$\Delta_i^j$', fontsize=20)
ax.set_ylabel(r'$\Delta_{i+1}^j$', fontsize=20)
tex = r'$\mathcal{R}\prod_{i=\alpha_{i+1}}^\infty a_i\sin(2 \pi f x_i)$'

ax.text(1, 1.6, tex, fontsize=20, va='bottom')

ax.legend([r"$\sqrt{x^2}$"])

ax.set_title(r'$\Delta_i^j \hspace{0.4} \mathrm{versus} \hspace{0.4} '
             r'\Delta_{i+1}^j$', fontsize=20)

show()