Version 2.0.0b1.post7580.dev0+ge487118


import matplotlib.pyplot as plt

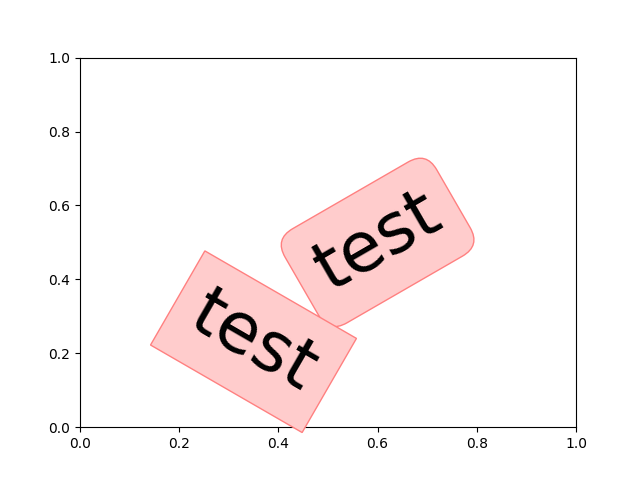
plt.text(0.6, 0.5, "test", size=50, rotation=30.,
         ha="center", va="center",
         bbox=dict(boxstyle="round",
                   ec=(1., 0.5, 0.5),
                   fc=(1., 0.8, 0.8),
                   )
         )

plt.text(0.5, 0.4, "test", size=50, rotation=-30.,
         ha="right", va="top",
         bbox=dict(boxstyle="square",
                   ec=(1., 0.5, 0.5),
                   fc=(1., 0.8, 0.8),
                   )
         )


plt.draw()
plt.show()