Version 2.0.0b1.post7580.dev0+ge487118
Matplotlib supports accented characters via TeX mathtext or unicode.
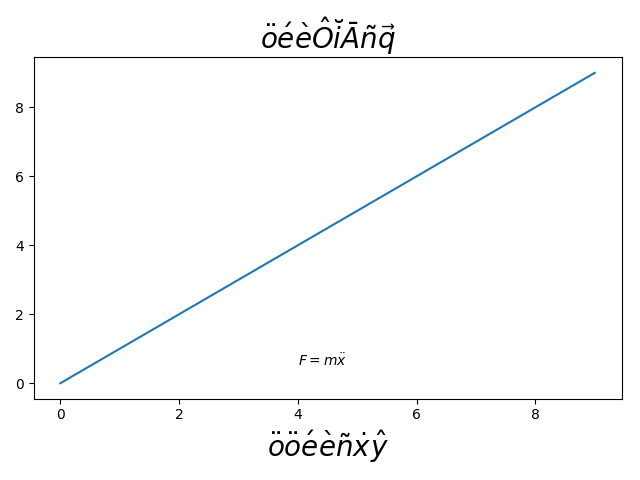
Using mathtext, the following accents are provided: hat, breve, grave, bar, acute, tilde, vec, dot, ddot. All of them have the same syntax, e.g., to make an overbar you do bar{o} or to make an o umlaut you do ddot{o}. The shortcuts are also provided, e.g.,: “o ‘e `e ~n .x ^y
from __future__ import unicode_literals
import matplotlib.pyplot as plt
# Mathtext demo
fig, ax = plt.subplots()
ax.plot(range(10))
ax.set_title(r'$\ddot{o}\acute{e}\grave{e}\hat{O}'
r'\breve{i}\bar{A}\tilde{n}\vec{q}$', fontsize=20)
# Shorthand is also supported and curly braces are optional
ax.set_xlabel(r"""$\"o\ddot o \'e\`e\~n\.x\^y$""", fontsize=20)
ax.text(4, 0.5, r"$F=m\ddot{x}$")
fig.tight_layout()
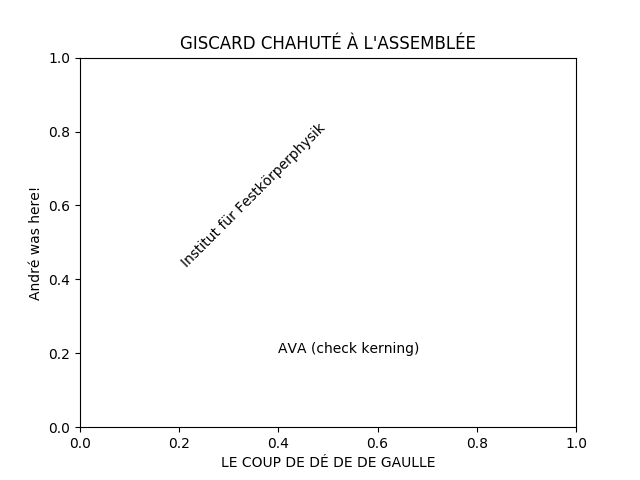
# Unicode demo
fig, ax = plt.subplots()
ax.set_title("GISCARD CHAHUTÉ À L'ASSEMBLÉE")
ax.set_xlabel("LE COUP DE DÉ DE DE GAULLE")
ax.set_ylabel('André was here!')
ax.text(0.2, 0.8, 'Institut für Festkörperphysik', rotation=45)
ax.text(0.4, 0.2, 'AVA (check kerning)')
plt.show()