Version 2.0.0b1.post7580.dev0+ge487118

Working with multiple figure windows and subplots
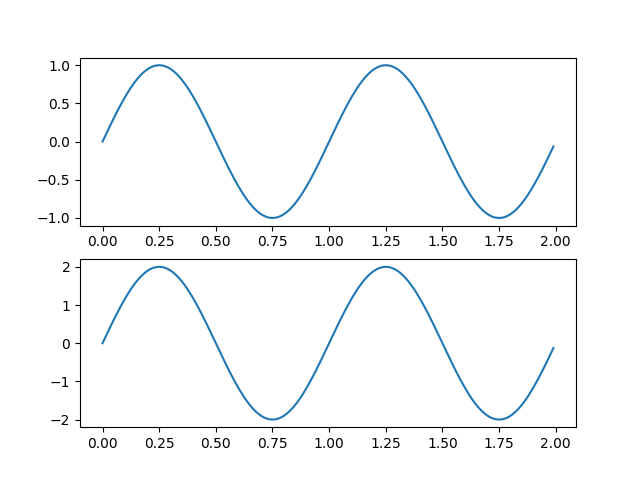
Create figure 1
plt.figure(1)
plt.subplot(211)
plt.plot(t, s1)
plt.subplot(212)
plt.plot(t, 2*s1)

Create figure 2
plt.figure(2)
plt.plot(t, s2)

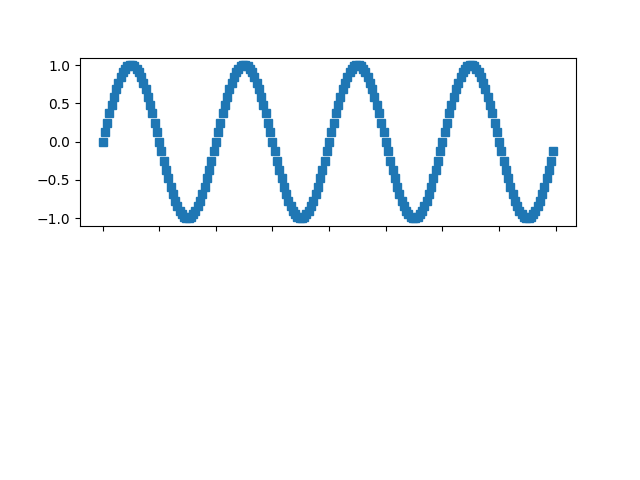
Now switch back to figure 1 and make some changes
plt.figure(1)
plt.subplot(211)
plt.plot(t, s2, 's')
ax = plt.gca()
ax.set_xticklabels([])

plt.show()
