Version 2.0.0b1.post7580.dev0+ge487118

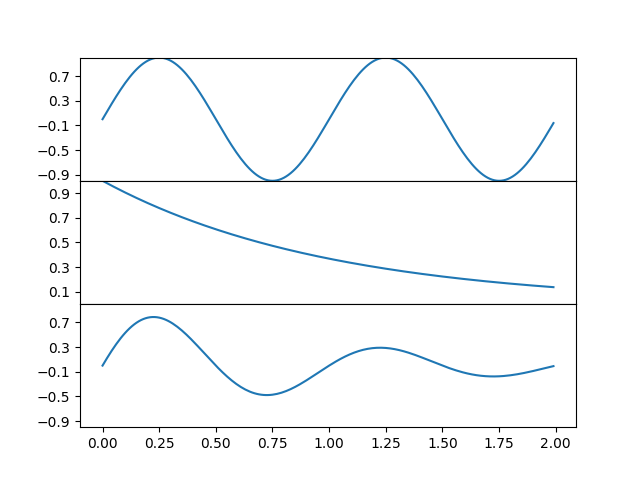
To create plots that share a common axis (visually) you can set the hspace between the subplots to zero. Passing sharex=True when creating the subplots will automatically turn off all x ticks and labels except those on the bottom axis.
In this example the plots share a common x axis but you can follow the same logic to supply a common y axis.

import matplotlib.pyplot as plt
import numpy as np

t = np.arange(0.0, 2.0, 0.01)

s1 = np.sin(2 * np.pi * t)
s2 = np.exp(-t)
s3 = s1 * s2

fig, axs = plt.subplots(3, 1, sharex=True)
# Remove horizontal space between axes
fig.subplots_adjust(hspace=0)

# Plot each graph, and manually set the y tick values
axs[0].plot(t, s1)
axs[0].set_yticks(np.arange(-0.9, 1.0, 0.4))
axs[0].set_ylim(-1, 1)

axs[1].plot(t, s2)
axs[1].set_yticks(np.arange(0.1, 1.0, 0.2))
axs[1].set_ylim(0, 1)

axs[2].plot(t, s3)
axs[2].set_yticks(np.arange(-0.9, 1.0, 0.4))
axs[2].set_ylim(-1, 1)

plt.show()