Version 2.0.0b1.post7580.dev0+ge487118
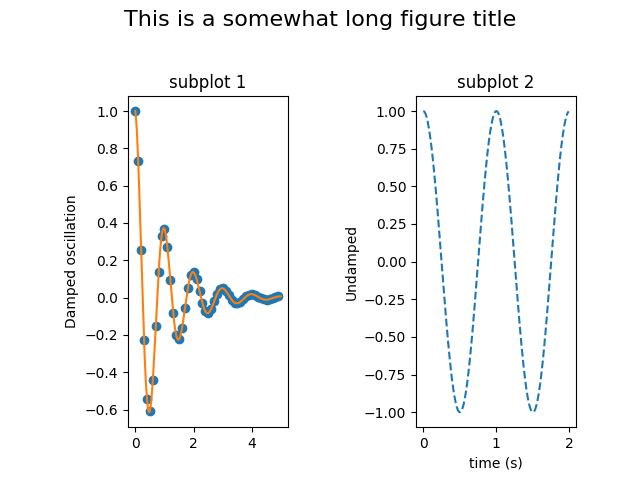
Create a figure with separate subplot titles and a centered figure title.
from matplotlib.font_manager import FontProperties
import matplotlib.pyplot as plt
import numpy as np


def f(t):
    s1 = np.cos(2*np.pi*t)
    e1 = np.exp(-t)
    return s1 * e1

t1 = np.arange(0.0, 5.0, 0.1)
t2 = np.arange(0.0, 5.0, 0.02)
t3 = np.arange(0.0, 2.0, 0.01)


plt.subplot(121)
plt.plot(t1, f(t1), 'o', t2, f(t2), '-')
plt.title('subplot 1')
plt.ylabel('Damped oscillation')
plt.suptitle('This is a somewhat long figure title', fontsize=16)


plt.subplot(122)
plt.plot(t3, np.cos(2*np.pi*t3), '--')
plt.xlabel('time (s)')
plt.title('subplot 2')
plt.ylabel('Undamped')

plt.subplots_adjust(left=0.2, wspace=0.8, top=0.8)

plt.show()