Version 2.0.0b1.post7580.dev0+ge487118

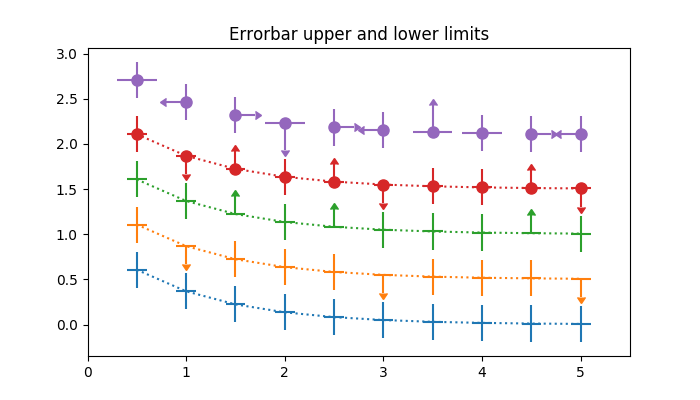
In matplotlib, errors bars can have “limits”. Applying limits to the
error bars essentially makes the error unidirectional. Because of that,
upper and lower limits can be applied in both the y- and x-directions
via the uplims, lolims, xuplims, and xlolims parameters,
respectively. These parameters can be scalar or boolean arrays.
For example, if xlolims is True, the x-error bars will only
extend from the data towards increasing values. If uplims is an
array filled with False except for the 4th and 7th values, all of the
y-error bars will be bidirectional, except the 4th and 7th bars, which
will extend from the data towards decreasing y-values.

import numpy as np
import matplotlib.pyplot as plt

# example data
x = np.array([0.5, 1.0, 1.5, 2.0, 2.5, 3.0, 3.5, 4.0, 4.5, 5.0])
y = np.exp(-x)
xerr = 0.1
yerr = 0.2

# lower & upper limits of the error
lolims = np.array([0, 0, 1, 0, 1, 0, 0, 0, 1, 0], dtype=bool)
uplims = np.array([0, 1, 0, 0, 0, 1, 0, 0, 0, 1], dtype=bool)
ls = 'dotted'

fig, ax = plt.subplots(figsize=(7, 4))

# standard error bars
ax.errorbar(x, y, xerr=xerr, yerr=yerr, linestyle=ls)

# including upper limits
ax.errorbar(x, y + 0.5, xerr=xerr, yerr=yerr, uplims=uplims,
            linestyle=ls)

# including lower limits
ax.errorbar(x, y + 1.0, xerr=xerr, yerr=yerr, lolims=lolims,
            linestyle=ls)

# including upper and lower limits
ax.errorbar(x, y + 1.5, xerr=xerr, yerr=yerr,
            lolims=lolims, uplims=uplims,
            marker='o', markersize=8,
            linestyle=ls)

# Plot a series with lower and upper limits in both x & y
# constant x-error with varying y-error
xerr = 0.2
yerr = np.zeros_like(x) + 0.2
yerr[[3, 6]] = 0.3

# mock up some limits by modifying previous data
xlolims = lolims
xuplims = uplims
lolims = np.zeros(x.shape)
uplims = np.zeros(x.shape)
lolims[[6]] = True  # only limited at this index
uplims[[3]] = True  # only limited at this index

# do the plotting
ax.errorbar(x, y + 2.1, xerr=xerr, yerr=yerr,
            xlolims=xlolims, xuplims=xuplims,
            uplims=uplims, lolims=lolims,
            marker='o', markersize=8,
            linestyle='none')

# tidy up the figure
ax.set_xlim((0, 5.5))
ax.set_title('Errorbar upper and lower limits')
plt.show()