Version 2.0.0b1.post7580.dev0+ge487118
import numpy as np
import matplotlib.pyplot as plt
import matplotlib.ticker as ticker
# Fixing random state for reproducibility
np.random.seed(19680801)
fig = plt.figure()
ax = fig.add_subplot(111)
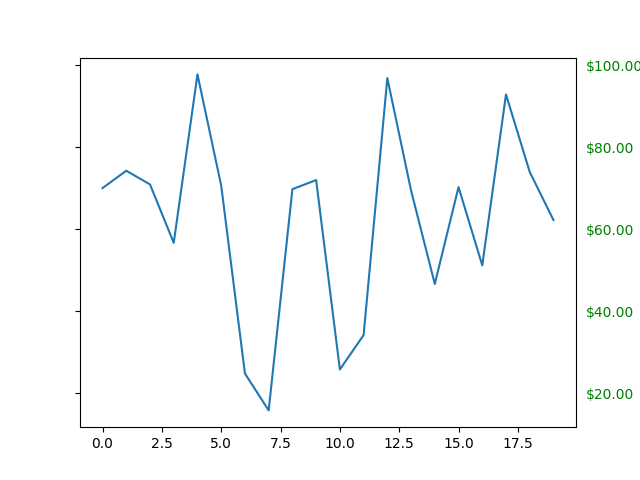
ax.plot(100*np.random.rand(20))
formatter = ticker.FormatStrFormatter('$%1.2f')
ax.yaxis.set_major_formatter(formatter)
for tick in ax.yaxis.get_major_ticks():
tick.label1On = False
tick.label2On = True
tick.label2.set_color('green')
plt.show()