Version 2.0.0b1.post7580.dev0+ge487118
import numpy as np
import matplotlib.pyplot as plt
fig = plt.figure()
ax = fig.add_subplot(111, polar=True)
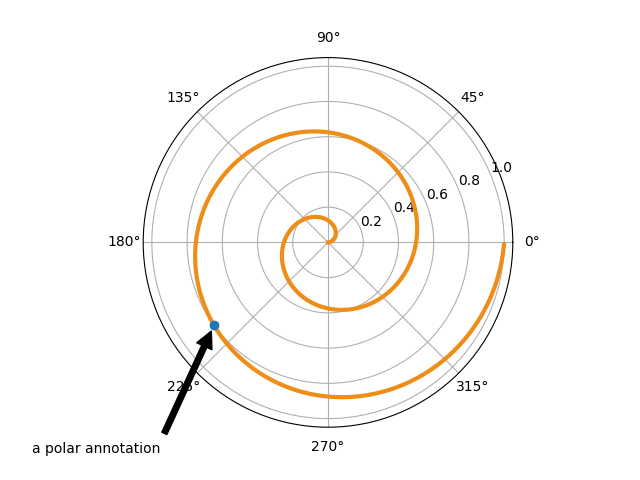
r = np.arange(0,1,0.001)
theta = 2 * 2*np.pi * r
line, = ax.plot(theta, r, color='#ee8d18', lw=3)
ind = 800
thisr, thistheta = r[ind], theta[ind]
ax.plot([thistheta], [thisr], 'o')
ax.annotate('a polar annotation',
xy=(thistheta, thisr), # theta, radius
xytext=(0.05, 0.05), # fraction, fraction
textcoords='figure fraction',
arrowprops=dict(facecolor='black', shrink=0.05),
horizontalalignment='left',
verticalalignment='bottom',
)
plt.show()