Version 2.0.0b1.post7580.dev0+ge487118
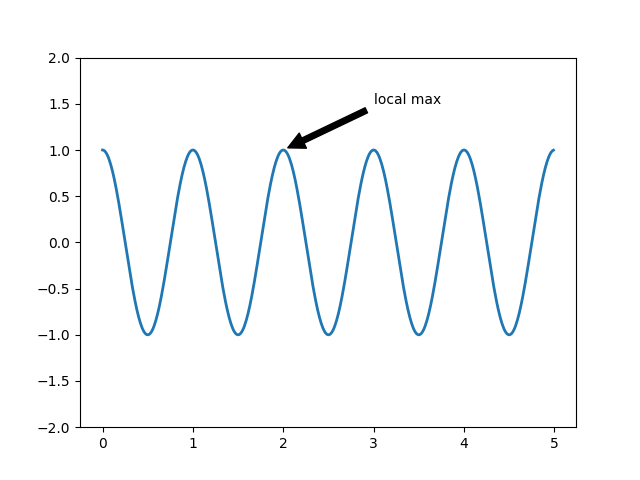
This example shows how to annotate a plot with an arrow pointing to provided coordinates. We modify the defaults of the arrow, to “shrink” it.
import numpy as np
import matplotlib.pyplot as plt

fig, ax = plt.subplots()

t = np.arange(0.0, 5.0, 0.01)
s = np.cos(2*np.pi*t)
line, = ax.plot(t, s, lw=2)

ax.annotate('local max', xy=(2, 1), xytext=(3, 1.5),
            arrowprops=dict(facecolor='black', shrink=0.05),
            )
ax.set_ylim(-2, 2)
plt.show()