Version 2.0.0b1.post7580.dev0+ge487118
Demo of a line plot on a polar axis.
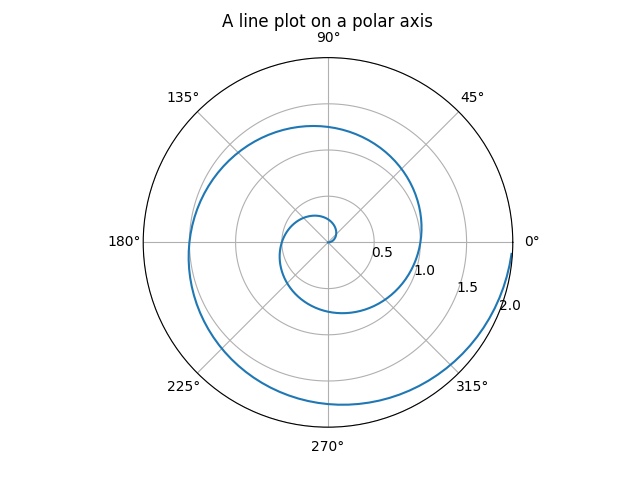
import numpy as np
import matplotlib.pyplot as plt


r = np.arange(0, 2, 0.01)
theta = 2 * np.pi * r

ax = plt.subplot(111, projection='polar')
ax.plot(theta, r)
ax.set_rmax(2)
ax.set_rticks([0.5, 1, 1.5, 2])  # Less radial ticks
ax.set_rlabel_position(-22.5)  # Move radial labels away from plotted line
ax.grid(True)

ax.set_title("A line plot on a polar axis", va='bottom')
plt.show()