Version 2.0.0b1.post7580.dev0+ge487118
Also demonstrates how transparency of the markers
can be adjusted by giving alpha a value between
0 and 1.
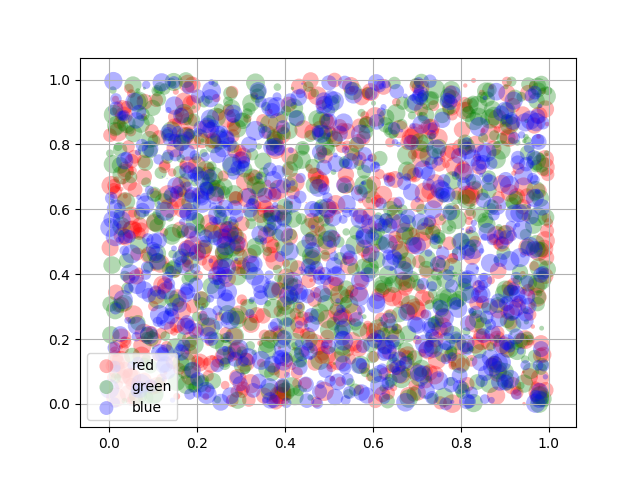
import matplotlib.pyplot as plt
from numpy.random import rand


fig, ax = plt.subplots()
for color in ['red', 'green', 'blue']:
    n = 750
    x, y = rand(2, n)
    scale = 200.0 * rand(n)
    ax.scatter(x, y, c=color, s=scale, label=color,
               alpha=0.3, edgecolors='none')

ax.legend()
ax.grid(True)

plt.show()