Version 2.0.0b1.post7580.dev0+ge487118
import numpy as np
import matplotlib.pyplot as plt
# Fixing random state for reproducibility
np.random.seed(19680801)
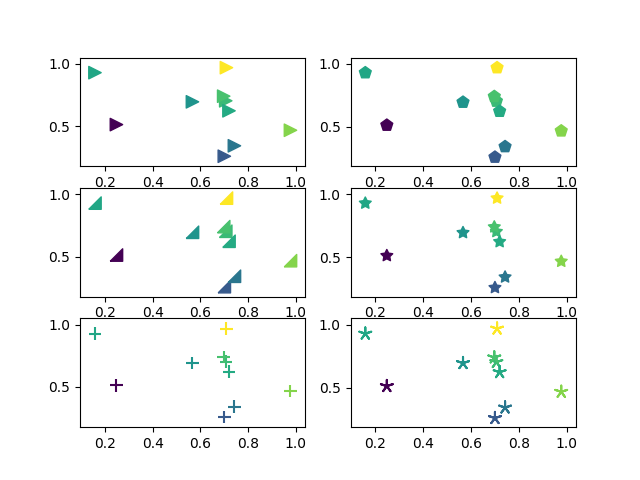
x = np.random.rand(10)
y = np.random.rand(10)
z = np.sqrt(x**2 + y**2)
plt.subplot(321)
plt.scatter(x, y, s=80, c=z, marker=">")
plt.subplot(322)
plt.scatter(x, y, s=80, c=z, marker=(5, 0))
verts = np.array([[-1, -1], [1, -1], [1, 1], [-1, -1]])
plt.subplot(323)
plt.scatter(x, y, s=80, c=z, marker=(verts, 0))
# equivalent:
# plt.scatter(x, y, s=80, c=z, marker=None, verts=verts)
plt.subplot(324)
plt.scatter(x, y, s=80, c=z, marker=(5, 1))
plt.subplot(325)
plt.scatter(x, y, s=80, c=z, marker='+')
plt.subplot(326)
plt.scatter(x, y, s=80, c=z, marker=(5, 2))
plt.show()