Version 2.0.0b1.post7580.dev0+ge487118
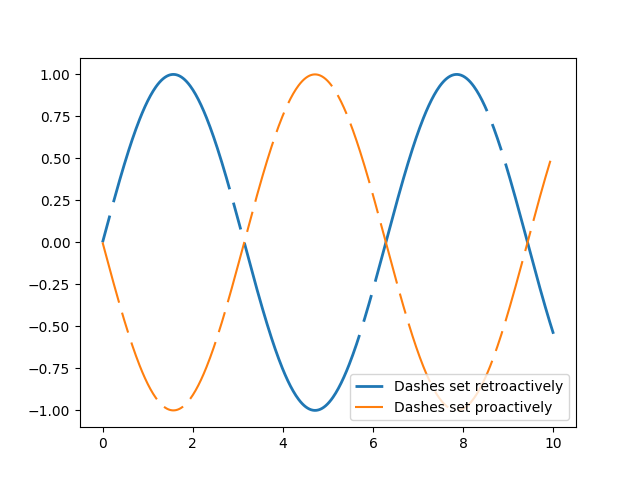
A Line object’s set_dashes method allows you to specify dashes with
a series of on/off lengths (in points).
import numpy as np
import matplotlib.pyplot as plt


x = np.linspace(0, 10, 500)
dashes = [10, 5, 100, 5]  # 10 points on, 5 off, 100 on, 5 off

fig, ax = plt.subplots()
line1, = ax.plot(x, np.sin(x), '--', linewidth=2,
                 label='Dashes set retroactively')
line1.set_dashes(dashes)

line2, = ax.plot(x, -1 * np.sin(x), dashes=[30, 5, 10, 5],
                 label='Dashes set proactively')

ax.legend(loc='lower right')
plt.show()