Version 2.0.0b1.post7580.dev0+ge487118
import matplotlib.pyplot as plt
from numpy import arange
from numpy.random import rand
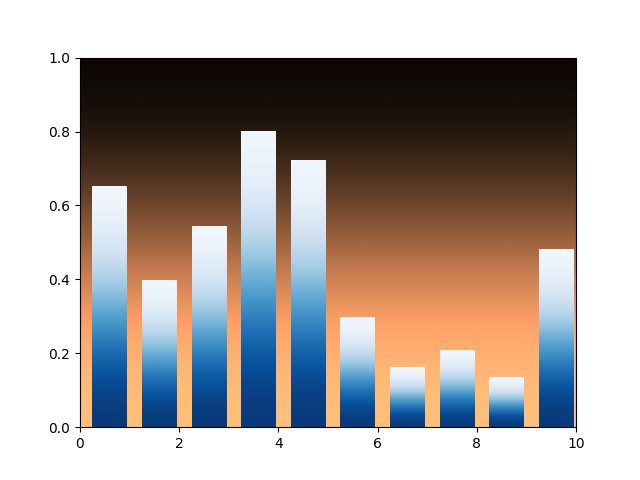
def gbar(ax, x, y, width=0.5, bottom=0):
X = [[.6, .6], [.7, .7]]
for left, top in zip(x, y):
right = left + width
ax.imshow(X, interpolation='bicubic', cmap=plt.cm.Blues,
extent=(left, right, bottom, top), alpha=1)
fig = plt.figure()
xmin, xmax = xlim = 0, 10
ymin, ymax = ylim = 0, 1
ax = fig.add_subplot(111, xlim=xlim, ylim=ylim,
autoscale_on=False)
X = [[.6, .6], [.7, .7]]
ax.imshow(X, interpolation='bicubic', cmap=plt.cm.copper,
extent=(xmin, xmax, ymin, ymax), alpha=1)
N = 10
x = arange(N) + 0.25
y = rand(N)
gbar(ax, x, y, width=0.7)
ax.set_aspect('auto')
plt.show()