Version 2.0.0b1.post7580.dev0+ge487118
Demo fill plot.
import numpy as np
import matplotlib.pyplot as plt
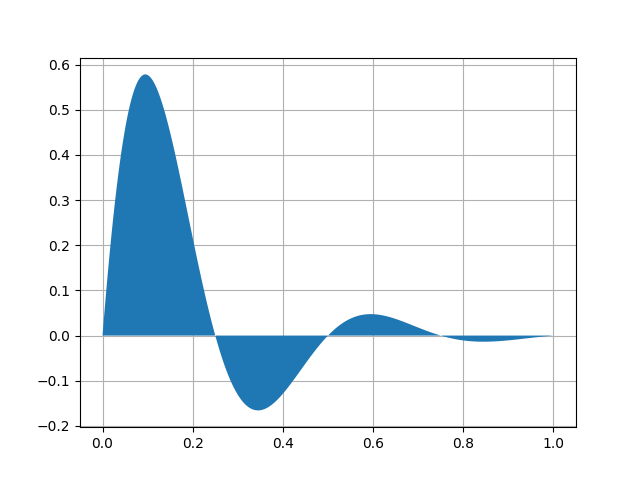
x = np.linspace(0, 1, 500)
y = np.sin(4 * np.pi * x) * np.exp(-5 * x)
First, the most basic fill plot a user can make with matplotlib:
fig, ax = plt.subplots()
ax.fill(x, y, zorder=10)
ax.grid(True, zorder=5)
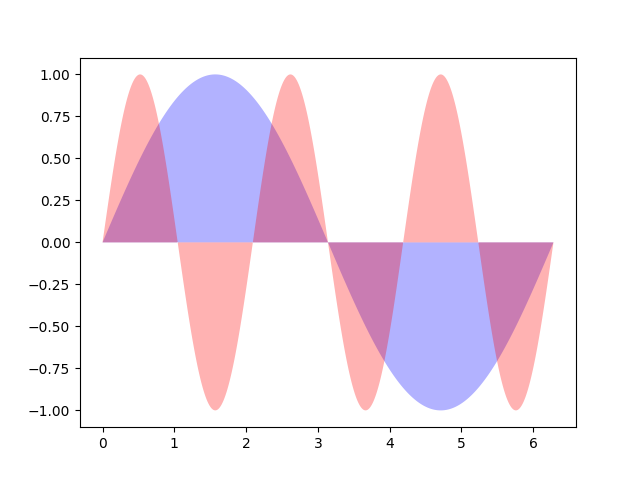
x = np.linspace(0, 2 * np.pi, 500)
y1 = np.sin(x)
y2 = np.sin(3 * x)
Next, a few more optional features:
fig, ax = plt.subplots()
ax.fill(x, y1, 'b', x, y2, 'r', alpha=0.3)
plt.show()