Version 2.0.0b1.post7580.dev0+ge487118

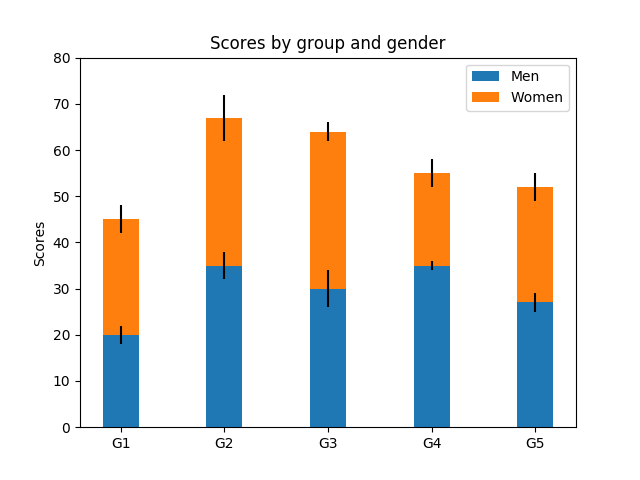
This is an example of creating a stacked bar plot with error bars
using bar. Note the parameters yerr used for
error bars, and bottom to stack the women’s bars on top of the men’s
bars.

import numpy as np
import matplotlib.pyplot as plt


N = 5
menMeans = (20, 35, 30, 35, 27)
womenMeans = (25, 32, 34, 20, 25)
menStd = (2, 3, 4, 1, 2)
womenStd = (3, 5, 2, 3, 3)
ind = np.arange(N)    # the x locations for the groups
width = 0.35       # the width of the bars: can also be len(x) sequence

p1 = plt.bar(ind, menMeans, width, yerr=menStd)
p2 = plt.bar(ind, womenMeans, width,
             bottom=menMeans, yerr=womenStd)

plt.ylabel('Scores')
plt.title('Scores by group and gender')
plt.xticks(ind, ('G1', 'G2', 'G3', 'G4', 'G5'))
plt.yticks(np.arange(0, 81, 10))
plt.legend((p1[0], p2[0]), ('Men', 'Women'))

plt.show()