Version 2.0.0b1.post7580.dev0+ge487118
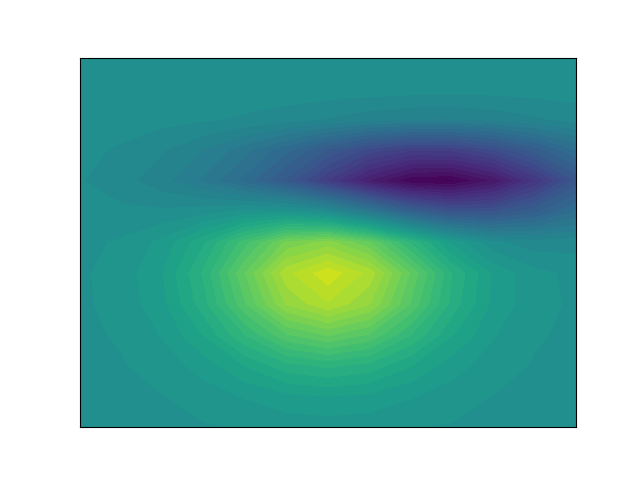
This example reproduces the frontpage contour example.
import matplotlib.pyplot as plt
import numpy as np
from matplotlib import mlab, cm

extent = (-3, 3, -3, 3)

delta = 0.5
x = np.arange(-3.0, 4.001, delta)
y = np.arange(-4.0, 3.001, delta)
X, Y = np.meshgrid(x, y)
Z1 = mlab.bivariate_normal(X, Y, 1.0, 1.0, 0.0, -0.5)
Z2 = mlab.bivariate_normal(X, Y, 1.5, 0.5, 1, 1)
Z = (Z1 - Z2) * 10

levels = np.linspace(-2.0, 1.601, 40)
norm = cm.colors.Normalize(vmax=abs(Z).max(), vmin=-abs(Z).max())

fig, ax = plt.subplots()
cset1 = ax.contourf(
    X, Y, Z, levels,
    norm=norm)
ax.set_xlim(-3, 3)
ax.set_ylim(-3, 3)
ax.set_xticks([])
ax.set_yticks([])
fig.savefig("contour_frontpage.png", dpi=25)  # results in 160x120 px image