Version 2.0.0b1.post7580.dev0+ge487118
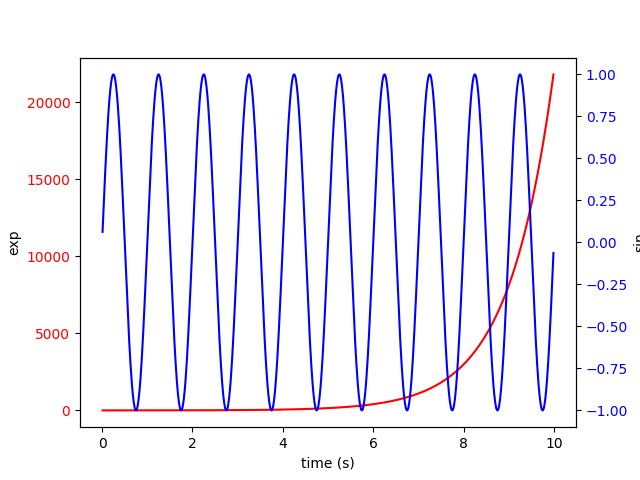
Demonstrate how to do two plots on the same axes with different left and right scales.
The trick is to use two different axes that share the same x axis.
You can use separate matplotlib.ticker formatters and locators as
desired since the two axes are independent.
Such axes are generated by calling the Axes.twinx method. Likewise,
Axes.twiny is available to generate axes that share a y axis but
have different top and bottom scales.
import numpy as np
import matplotlib.pyplot as plt


def two_scales(ax1, time, data1, data2, c1, c2):
    """

    Parameters
    ----------
    ax : axis
        Axis to put two scales on

    time : array-like
        x-axis values for both datasets

    data1: array-like
        Data for left hand scale

    data2 : array-like
        Data for right hand scale

    c1 : color
        Color for line 1

    c2 : color
        Color for line 2

    Returns
    -------
    ax : axis
        Original axis
    ax2 : axis
        New twin axis
    """
    ax2 = ax1.twinx()

    ax1.plot(time, data1, color=c1)
    ax1.set_xlabel('time (s)')
    ax1.set_ylabel('exp')

    ax2.plot(time, data2, color=c2)
    ax2.set_ylabel('sin')
    return ax1, ax2


# Create some mock data
t = np.arange(0.01, 10.0, 0.01)
s1 = np.exp(t)
s2 = np.sin(2 * np.pi * t)

# Create axes
fig, ax = plt.subplots()
ax1, ax2 = two_scales(ax, t, s1, s2, 'r', 'b')


# Change color of each axis
def color_y_axis(ax, color):
    """Color your axes."""
    for t in ax.get_yticklabels():
        t.set_color(color)
    return None
color_y_axis(ax1, 'r')
color_y_axis(ax2, 'b')
plt.show()