mpl_toolkits.axes_grid1.host_subplot
mpl_toolkits.axes_grid1.
host_subplot
Create a subplot that can act as a host to parasitic axes.
figure : matplotlib.figure.Figure
matplotlib.figure.Figure
Figure to which the subplot will be added. Defaults to the current figure pyplot.gcf().
pyplot.gcf()
*args, **kwargs :
Will be passed on to the underlying Axes object creation.
Axes
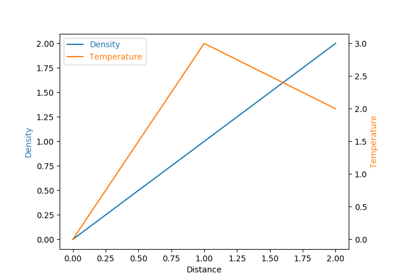
Parasite Simple
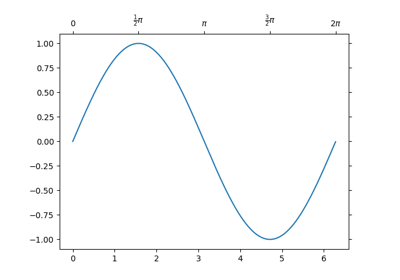
Simple Axisline4
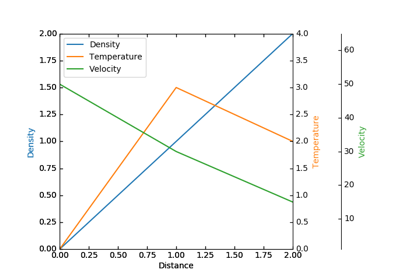
Demo Parasite Axes2