Version 2.0.0b1.post7580.dev0+ge487118
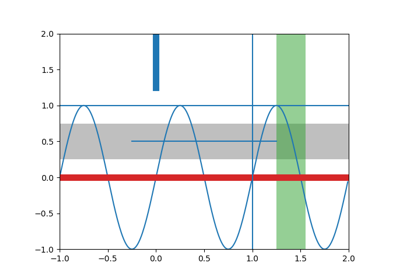
matplotlib.pyplot.axhline(y=0, xmin=0, xmax=1, hold=None, **kwargs)¶Add a horizontal line across the axis.
| Parameters: | y : scalar, optional, default: 0
xmin : scalar, optional, default: 0
xmax : scalar, optional, default: 1
|
||||||||||||||||||||||||||||||||||||||||||||||||||||||||||||||||||||||||||||||||||
|---|---|---|---|---|---|---|---|---|---|---|---|---|---|---|---|---|---|---|---|---|---|---|---|---|---|---|---|---|---|---|---|---|---|---|---|---|---|---|---|---|---|---|---|---|---|---|---|---|---|---|---|---|---|---|---|---|---|---|---|---|---|---|---|---|---|---|---|---|---|---|---|---|---|---|---|---|---|---|---|---|---|---|---|
| Returns: | |||||||||||||||||||||||||||||||||||||||||||||||||||||||||||||||||||||||||||||||||||
| Other Parameters: | |||||||||||||||||||||||||||||||||||||||||||||||||||||||||||||||||||||||||||||||||||
**kwargs :
|
|||||||||||||||||||||||||||||||||||||||||||||||||||||||||||||||||||||||||||||||||||
See also
Notes
kwargs are passed to Line2D and can be used
to control the line properties.
Examples
draw a thick red hline at ‘y’ = 0 that spans the xrange:
>>> axhline(linewidth=4, color='r')
draw a default hline at ‘y’ = 1 that spans the xrange:
>>> axhline(y=1)
draw a default hline at ‘y’ = .5 that spans the middle half of the xrange:
>>> axhline(y=.5, xmin=0.25, xmax=0.75)