Posts tagged visualizations
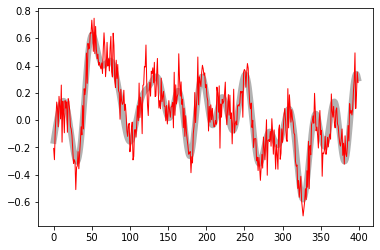
Matplotlib Cyclers are Great
- 04 January 2017
Every now and then I come across a nifty feature in Matplotlib that I wish I’d known about earlier. The MPL documentation can be a beast to get through, and as a result you miss some cool stuff sometimes.
This is a quick demo of one such feature: the cycler.
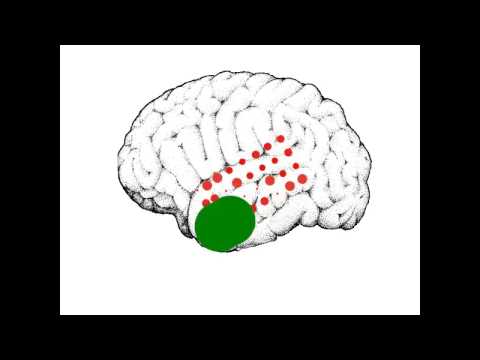
Brainy Jingle Bells
- 23 December 2016
This is a quick demo of how I created this video. Check it out below, or read on to see the code that made it!
Here’s a quick viz to show off some brainy holiday spirit.
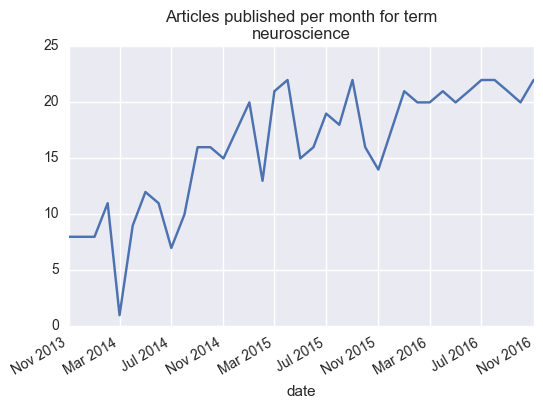
The bleeding edge of publishing, Scraping publication amounts at biorxiv
- 19 December 2016
Per a recent request somebody posted on Twitter, I thought it’d be fun to write a quick scraper for the biorxiv, an excellent new tool for posting pre-prints of articles before they’re locked down with a publisher embargo.
A big benefit of open science is the ability to use modern technologies (like web scraping) to make new use of data that would originally be unavailable to the public. One simple example of this is information and metadata about published articles. While we’re not going to dive too deeply here, maybe this will serve as inspiration for somebody else interested in scraping the web.
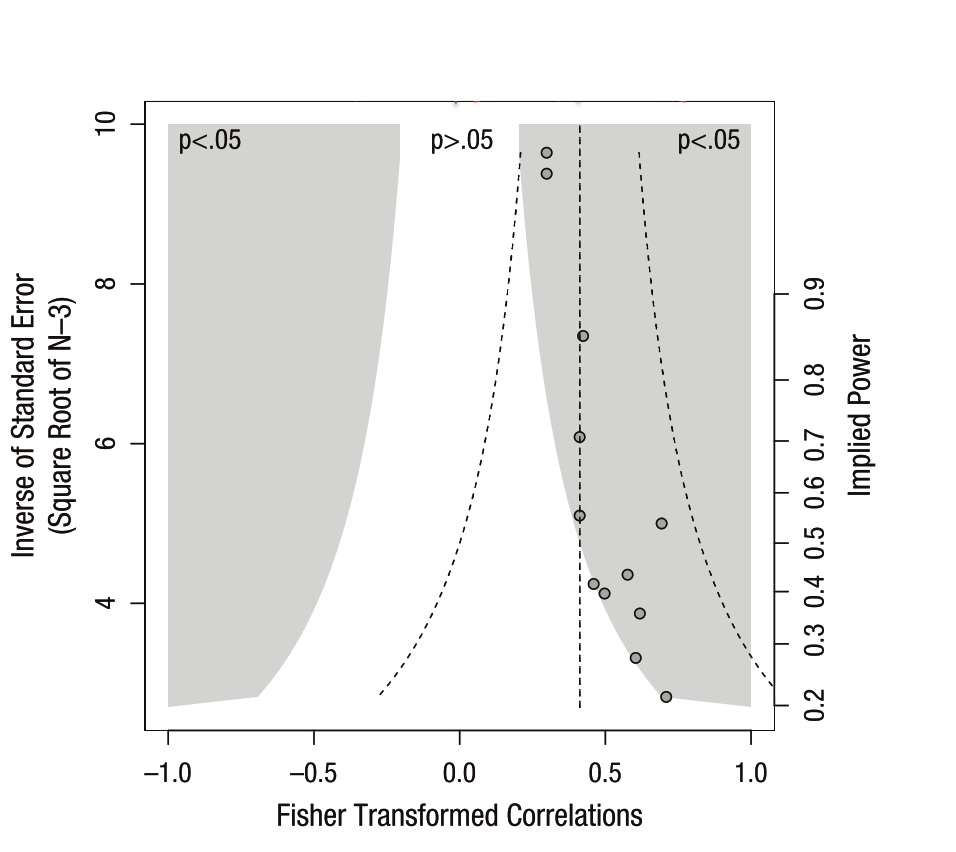
Visualizing publication bias
- 30 November 2016
This article is now interactive! Check out a live Binder instance here
In the next few months, I’ll try to take some time to talk about the things I learn as I make my way through this literature. While it’s easy to make one-off complaints to one another about how “science is broken” without really diving into the details, it’s important learn about how it’s broken, or at least how we could assess something like this.