Posts tagged visualization
NIH grant analysis
- 29 October 2015
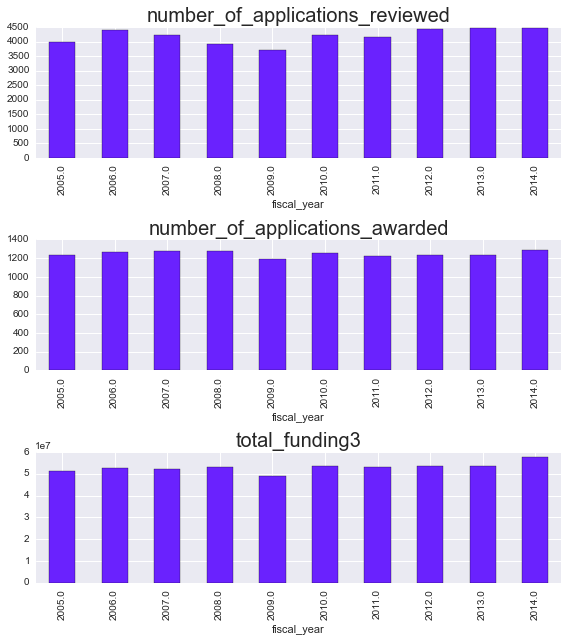
As I’m entering the final years of graduate school, I’ve been applying for a few typical “pre-doc” fellowships. One of these is the NRSA, which is notorious for requiring you to wade through forests of beaurocratic documents (seriously, their “guidelines” for writing an NRSA are over 100 pages!). Doing so ends up taking a LOT of time.
This got me wondering what kind of success rates these grants have in the first place. For those who haven’t gone through the process before, it’s a bit opaque:
Craigslist data analysis
- 27 September 2015
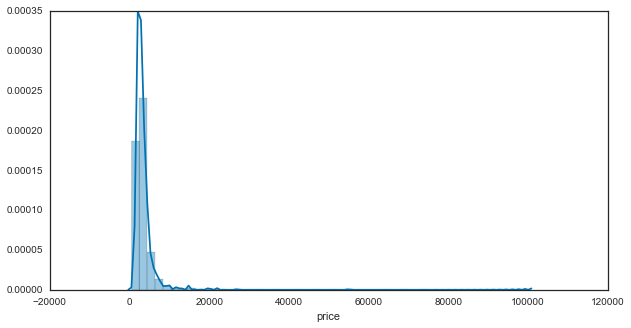
In the last post I showed how to use a simple python bot to scrape data from Criagslist. This is a quick follow-up to take a peek at the data.
Note - data that you scrape from Craigslist is pretty limited. They tend to clear out old posts, and you can only scrape from recent posts anyway to avoid them blocking you.