Posted in 2017
Combining dates with analysis visualization in python
- 02 November 2017
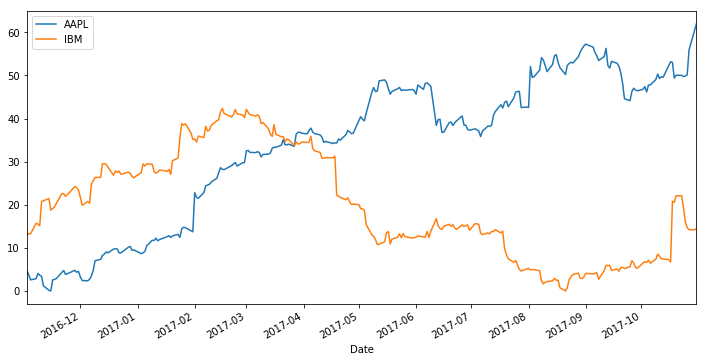
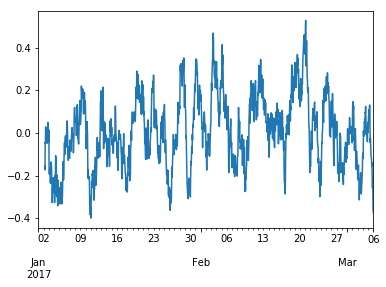
Sometimes you want to do two things:
Plot a timeseries that handles datetimes in a clever way (e.g., with Pandas or Matplotlib)
Dates in python
- 16 March 2017
As a part of setting up the website for the Docathon I’ve had to re-learn all of my date string formatting rules. It’s one of those little problems you don’t really think about - turning an arbitrary string into something structured like a date - until you’ve actually got to do it.
There are a bunch of tools in python for using date-like objects, but it’s not always easy to figure out how these work. This post is just a couple of pieces of information I’ve picked up along the process.
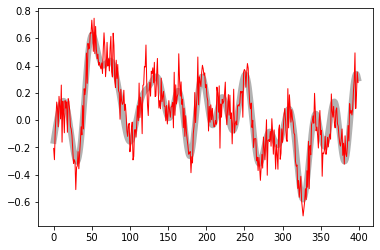
Matplotlib Cyclers are Great
- 04 January 2017
Every now and then I come across a nifty feature in Matplotlib that I wish I’d known about earlier. The MPL documentation can be a beast to get through, and as a result you miss some cool stuff sometimes.
This is a quick demo of one such feature: the cycler.